
Kubernetes Network Debugging
If you troubleshoot network issues in Kubernetes, especially in cloud environments, the reason for something failure can get complex.
- Cloud: VPCs, routes, firewalls, load balancers, NAT gateways
- Kubernetes: pods, services, network policies, overlay networks, ingress controllers, gateway APIs
You can set up observability metrics and add them to a dashboard, but you won’t capture details down to the packet or system call level.
Let’s build out a lab to experiment with doing just that.
Edit: Find the TikTok video about this post here: tiktok.com/@erik_horton
Setup
We’ll cover:
- Netshoot and basic connectivity testing like you would do on a regular Linux host
- Inspektor Gadget for eBPF-based kernel-level observability
- Performance testing with iperf3
- Ephemeral containers for debugging in the context of an existing pod
Skip to the Debugging with Netshoot section if you already have a cluster to troubleshoot in.
Kind cluster
Create a kind cluster to test with. For example:
kind create cluster --name networkinglab --config - <<EOF
kind: Cluster
apiVersion: kind.x-k8s.io/v1alpha4
nodes:
  - role: control-plane
  - role: worker
  - role: worker
  - role: worker
EOF
deployment.yaml
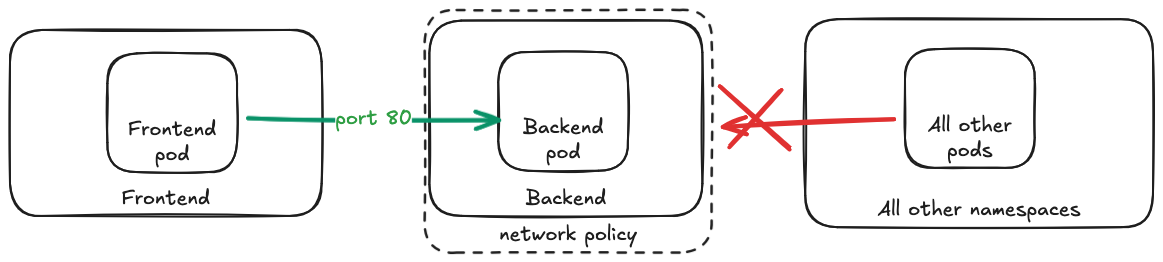
We will create a simple deployment with the following resources:
- 2 namespaces (frontend/backend)
- 2 pods (frontend-pod/backend-pod)
- 1 service for the backend pod
- 1 network policy that allows traffic from the frontend namespace to the backend namespace
deployment.yaml
apiVersion: v1
kind: Namespace
metadata:
  name: frontend
---
apiVersion: v1
kind: Namespace
metadata:
  name: backend
---
apiVersion: v1
kind: Pod
metadata:
  name: frontend-pod
  namespace: frontend
  labels:
    app: frontend
spec:
  containers:
  - name: frontend
    image: nginx
    ports:
    - containerPort: 80
---
apiVersion: v1
kind: Pod
metadata:
  name: backend-pod
  namespace: backend
  labels:
    app: backend
spec:
  containers:
  - name: backend
    image: nginx
    ports:
    - containerPort: 80
---
apiVersion: v1
kind: Service
metadata:
  name: backend
  namespace: backend
spec:
  selector:
    app: backend
  ports:
  - port: 80
    targetPort: 80
---
apiVersion: networking.k8s.io/v1
kind: NetworkPolicy
metadata:
  name: allow-frontend-to-backend
  namespace: backend
spec:
  podSelector:
    matchLabels:
      app: backend
  policyTypes:
  - Ingress
  ingress:
  - from:
    - namespaceSelector:
        matchLabels:
          kubernetes.io/metadata.name: frontend
    ports:
    - protocol: TCP
      port: 80
Apply the deployment:
kubectl apply -f deployment.yaml
Debugging with Netshoot
Frontend to Backend
kubectl run netshoot --rm -it -n frontend --image=nicolaka/netshoot -- bash

# inside the netshoot container, this should work:
curl backend.backend.svc.cluster.local

# or this
nc -vz backend.backend 80
# Connection to backend.backend (10.96.205.180) 80 port [tcp/http] succeeded!
Default Namespace to Backend
kubectl run netshoot --rm -it --image=nicolaka/netshoot -- bash

# inside the netshoot container, this should fail:
curl --connect-timeout 2 backend.backend.svc.cluster.local
# curl: (28) Connection timed out after 2002 milliseconds

# or this
nc -vz -w 2 backend.backend 80
# nc: connect to backend.backend (10.96.205.180) port 80 (tcp) timed out: Operation in progress
kc-netshoot script
There’s a really nice script called kc-netshoot.sh (kubectl-netshoot) that:
- Creates a netshoot pod on a desired node (nodeSelector ->
kubernetes.io/hostname: <node-name>) - Gives it host network access (
hostNetwork: true) - Mounts the host’s root volume as read-only (
hostPath: /, mountPath: /host, readOnly: true) - Sets the security context to privileged (allowing it to run tools like tcpdump)
With this privileged container targetting the same node as our backend pod (or the node where the source traffic is coming from), we can actually inspect the traffic going to the backend pod even if we aren’t in the same namespace that has access through the network policy.
# change this to the same node where the backend pod is running
~/scripts/kc-netshoot.sh networkinglab-worker

# inside the privileged netshoot container, see traffic to the backend pod
tcpdump -i any -nnv port 80
In another terminal, run:
kubectl run netshoot --rm -it -n frontend --image=nicolaka/netshoot -- bash

# inside the netshoot container, this should work:
curl backend.backend.svc.cluster.local
You should see the traffic in the tcpdump output.
Other tools
You’ll have access to a lot of common Linux tools, so you can use the same techniques you would on a regular host to debug connectivity, DNS, routing, interfaces, and more.
Connectivity
# Basic ICMP reachability.
# Use when: checking if host is up or path is blocked.
ping <host>
# Test MTU and fragmentation.
# Use when: suspecting packet loss due to MTU issues.
ping -M do -s 1472 <host>
# Network path and where traffic stops.
# Use when: packets die somewhere in transit.
traceroute <host>
# Similar to traceroute but also tests MTU along the path.
# Use when: suspecting MTU issues.
tracepath <host>
# Full HTTP request/response details.
# Use when: API/service responds incorrectly.
curl -v <url>
# Whether a TCP port is open.
# Use when: distinguishing blocked port vs app down.
nc -vz <host> <port>
DNS
# DNS resolution result.
# Use when: service name is not resolving.
dig <name>
# Query result from cluster DNS directly.
# Use when: testing CoreDNS vs node DNS.
dig @10.96.0.10 kubernetes.default.svc.cluster.local
# Trace DNS query path and timing.
# Use when: diagnosing slow DNS or unexpected query paths.
dig +trace <name>
# Configured nameserver/search domains.
# Use when: debugging wrong DNS server or search suffix.
cat /etc/resolv.conf

# search backend.svc.cluster.local svc.cluster.local cluster.local
# nameserver 10.96.0.10
# options ndots:5
A pod’s DNS lookups follow the OS resolver rules in /etc/resolv.conf. With a search list and an options ndots:N setting, any name that has fewer than N dots is treated as “relative” first: the resolver will try the name with each search suffix appended (in order) before finally trying the bare name.
When you trace DNS traffic, this can look like “repeated” lookups for the same hostname, just with different suffixes.
# To avoid search-path expansion, query an absolute FQDN with a trailing dot
curl https://blog.erikhorton.com.
# blog.erikhorton.com	0.002697667

curl https://blog.erikhorton.com
# blog.erikhorton.com.backend.svc.cluster.local	0.001185917
# blog.erikhorton.com.svc.cluster.local	0.000409917
# blog.erikhorton.com.cluster.local	0.000497708
# blog.erikhorton.com	0.005431667
Ports
# Listening ports and owning processes.
# Use when: checking if service is actually listening.
ss -tulnp
# Active TCP connections.
# Use when: verifying whether connections are established.
ss -tnp
Routing
# Routing table entries.
# Use when: checking wrong gateway or route.
ip route
Interfaces
# Interface IP addresses/subnets.
# Use when: verifying missing IP or wrong subnet.
ip addr
# Interface state (including CNI links).
# Use when: tracking interface/CNI issues.
ip link
Packet capture
# Live packet flow.
# Use when: traffic leaves but no return traffic arrives.
tcpdump -i any
# Filter for TCP port 80 traffic.
# Use when: looking for specific service traffic.
tshark -i eth0 -Y "tcp.port==80"
# Filter for HTTP requests.
# Use when: looking for specific traffic patterns.
tshark -i any -Y "http.request"
# Identify retransmissions.
# Use when: suspecting packet loss.
tshark -i eth0 -Y "tcp.analysis.retransmission" -T fields -e ip.src -e ip.dst -e tcp.seq
# Live DNS response queries.
# Use when: seeing what DNS queries are being made and their latency.
tshark -i any -f "udp port 53 or tcp port 53" -Y "dns.flags.response == 1" -T fields -e frame.time -e ip.src -e ip.dst -e dns.qry.name -e dns.time
Connection tracking
# Conntrack/NAT state table.
# Use when: suspecting NAT exhaustion or stuck flows.
conntrack -L
Service routing
# Kubernetes NAT/kube-proxy rules.
# Use when: debugging NodePort or kube-proxy pathing.
iptables -t nat -L -n -v
Performance
# Network throughput testing — run server on one pod, client on another.
# Use when: measuring bandwidth between pods.
iperf3 -s
iperf3 -c <server>
# Detailed timing breakdown for HTTP requests.
# Use when: diagnosing slow service responses.
curl -o /dev/null -s -w "DNS: %{time_namelookup}\nConnect: %{time_connect}\nTTFB: %{time_starttransfer}\nTotal: %{time_total}\n" http://backend.backend
# Measure DNS resolution time.
# Use when: suspecting slow DNS.
time dig backend.backend

# Multiple DNS resolution timings.
# Use when: checking for variability or caching effects.
for i in {1..5}; do time dig backend.backend > /dev/null; done

# or the aforementioned capture to see DNS query times in real time:
tshark -i any -f "udp port 53 or tcp port 53" -Y "dns.flags.response == 1" -T fields -e frame.time -e ip.src -e ip.dst -e dns.qry.name -e dns.time
Filesystem
Because this container has access to the host’s root filesystem, you can inspect logs and configuration files directly at the /host path.
# Check a pod's logs directly from the host filesystem by following the symlinks and prefixing with /host
ls -l /host/var/log/containers | grep kube-proxy
# lrwxrwxrwx    1 root     root            96 Feb 17 23:15 kube-proxy-zk9bf_kube-system_kube-proxy-80b8825259271e12cced266e1928505554938b52d8ce9d90424b7b25eabcdc52.log -> /var/log/pods/kube-system_kube-proxy-zk9bf_624adcda-32f7-4d8f-90db-d3a274a6e4bf/kube-proxy/0.log

cat /host/var/log/pods/kube-system_kube-proxy-zk9bf_624adcda-32f7-4d8f-90db-d3a274a6e4bf/kube-proxy/0.log

# Check space taken by images and containers
du -sh /host/var/lib/containerd/*
Performance testing
You can also use tools like iperf3 to test network performance between pods. For example, you can run an iperf3 server:
performance-lab.yaml
performance-lab.yaml
apiVersion: v1
kind: Namespace
metadata:
  name: performance
---
apiVersion: apps/v1
kind: Deployment
metadata:
  name: iperf-server
  namespace: performance
spec:
  replicas: 1
  selector:
    matchLabels:
      app: iperf-server
  template:
    metadata:
      labels:
        app: iperf-server
    spec:
      containers:
      - name: iperf3
        image: networkstatic/iperf3:latest
        args: ["-s"]
        ports:
        - name: iperf3
          containerPort: 5201
---
apiVersion: v1
kind: Service
metadata:
  name: iperf-server
  namespace: performance
spec:
  selector:
    app: iperf-server
  ports:
  - name: iperf3
    port: 5201
    targetPort: 5201
Apply the yaml.
kubectl apply -f performance-lab.yaml
Then start up a netshoot client and run an iperf3 test:
kubectl run netshoot --rm -it --image=nicolaka/netshoot

# inside the netshoot container, run iperf3 client test to the server
iperf3 -c iperf-server.performance.svc.cluster.local
If you’re looking for more details on performance testing in general, Brendan Gregg has a lot of content on that.
Ephemeral containers
Kubernetes also has a built-in feature called ephemeral containers that allows you to temporarily attach a debugging container to an existing pod. This can be useful for debugging issues in a running pod without needing to create a separate netshoot pod.
To use ephemeral containers, you can attach a netshoot container to the backend pod with the following:
kubectl debug -it -n backend pod/backend-pod --image=nicolaka/netshoot --target=backend
This is beneficial because it allows you to run debugging tools directly in the context of the existing pod, which can be helpful for diagnosing issues that are specific to that pod’s environment.
All containers in the same Pod share the same network namespace and IP address, and they can share storage volumes defined on the Pod. This means that the ephemeral container can see the same network interfaces, IP addresses, and processes as the original container. This is particularly useful for debugging network issues, as you can run tools like tcpdump or iperf3 directly in the context of the existing pod, even when the tools wouldn’t be available normally.
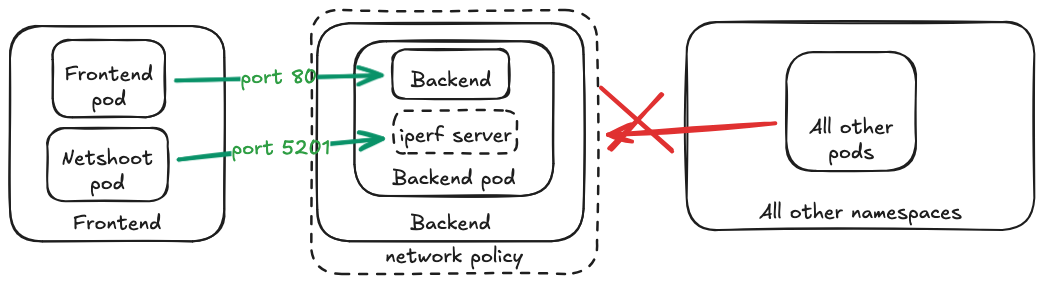
Using the iperf example, if we want to test the connectivity between two pods, we can attach an ephemeral iperf server to an existing pod and then run the iperf client from another pod.
iperf.yaml
First add a service and NetworkPolicy for backend-iperf:
iperf.yaml
apiVersion: v1
kind: Service
metadata:
  name: backend-iperf
  namespace: backend
spec:
  selector:
    app: backend
  ports:
  - port: 5201
    targetPort: 5201
---
apiVersion: networking.k8s.io/v1
kind: NetworkPolicy
metadata:
  name: allow-frontend-iperf-to-backend
  namespace: backend
spec:
  podSelector:
    matchLabels:
      app: backend
  policyTypes:
  - Ingress
  ingress:
  - from:
    - namespaceSelector:
        matchLabels:
          kubernetes.io/metadata.name: frontend
    ports:
    - protocol: TCP
      port: 5201
And apply the yaml:
kubectl apply -f iperf.yaml
Then you can set up ephemeral iperf server and run the client test from the frontend namespace:
# Attach an ephemeral iperf server to the backend pod
kubectl debug -it -n backend pod/backend-pod --image=networkstatic/iperf3:latest --target=backend -- iperf3 -s

# In another terminal, run the iperf client from the frontend pod
kubectl run netshoot --rm -it -n frontend --image=nicolaka/netshoot

# inside the netshoot container, run iperf3 client test to the ephemeral server
iperf3 -c backend-iperf.backend.svc.cluster.local
Inspektor Gadget
Netshoot gives you a shell inside the network namespace with a lot of useful tools that you might already be familiar with. Sometimes, though, the problem isn’t visible from inside the pod. It might live in the kernel, in kube-proxy, or somewhere along the packet path before it ever reaches your container.
Inspektor Gadget is an eBPF-based toolkit for Kubernetes. Instead of exec’ing into a pod and running tools manually, it attaches to kernel events on the node and lets you observe what’s happening in real time: TCP connects, DNS lookups, dropped packets, retransmissions, even HTTP traffic.
Use Inspektor Gadget if you’re seeing behavior like:
- Connections that hang with no obvious error
- Traffic that leaves a pod but never seems to return
- Intermittent packet drops
- Retransmissions with no clear cause
Netshoot can show you what the pod sees. Inspektor Gadget can show you what the kernel sees.
# https://krew.sigs.k8s.io/docs/user-guide/quickstart/
kubectl krew install gadget
kubectl gadget deploy # installs a DaemonSet
kubectl get pods -n gadget

# Trace TCP connects/accepts across the cluster
kubectl gadget run trace_tcp:latest -A

# Or limit to backend pods by label + namespace
kubectl gadget run trace_tcp:latest -n backend -l app=backend

# Trace DNS queries from the frontend namespace
kubectl gadget run trace_dns:latest -n frontend

# Trace new processes being executed
kubectl gadget run trace_exec:latest -n frontend

# Trace files being opened
kubectl gadget run trace_open:latest -n frontend
Note that Inspektor Gadget is not a replacement for some of the basic tools we covered earlier. It’s a powerful addition to your toolkit, but it has its limitations:
- Does not capture full packet payloads
- Use:
tcpdump -i any
- Use:
- Does not show past events (live tracing only)
- Use: centralized logs, metrics, or flow logs
- Does not explain application errors or business logic
- Use:
kubectl logs, application logs, tracing, APM tools
- Use:
- Does not replace basic connectivity testing
- Use:
curl,nc -vz,dig,ss -tulnp
- Use:
To clean up:
kubectl gadget undeploy # removes the DaemonSet